|
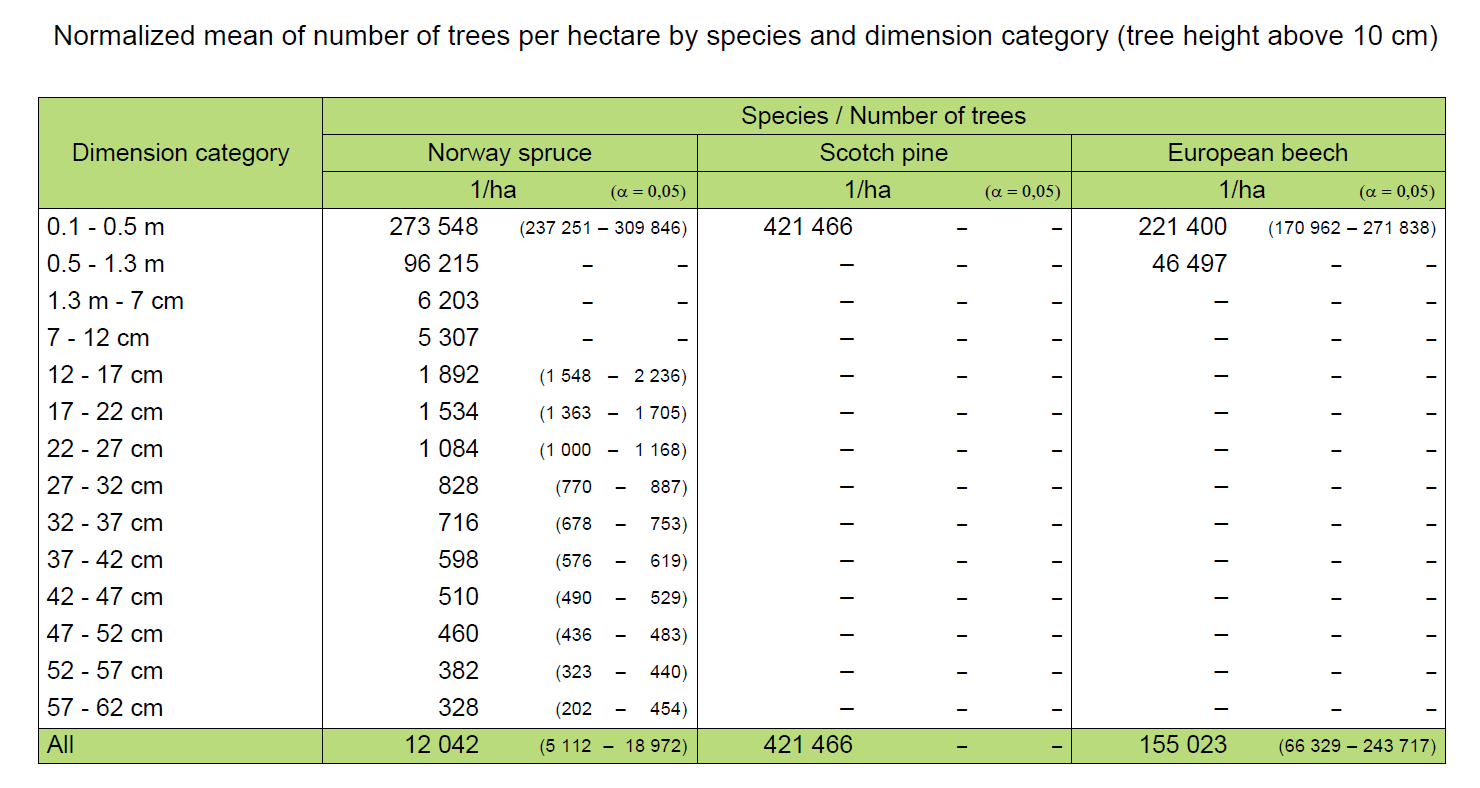
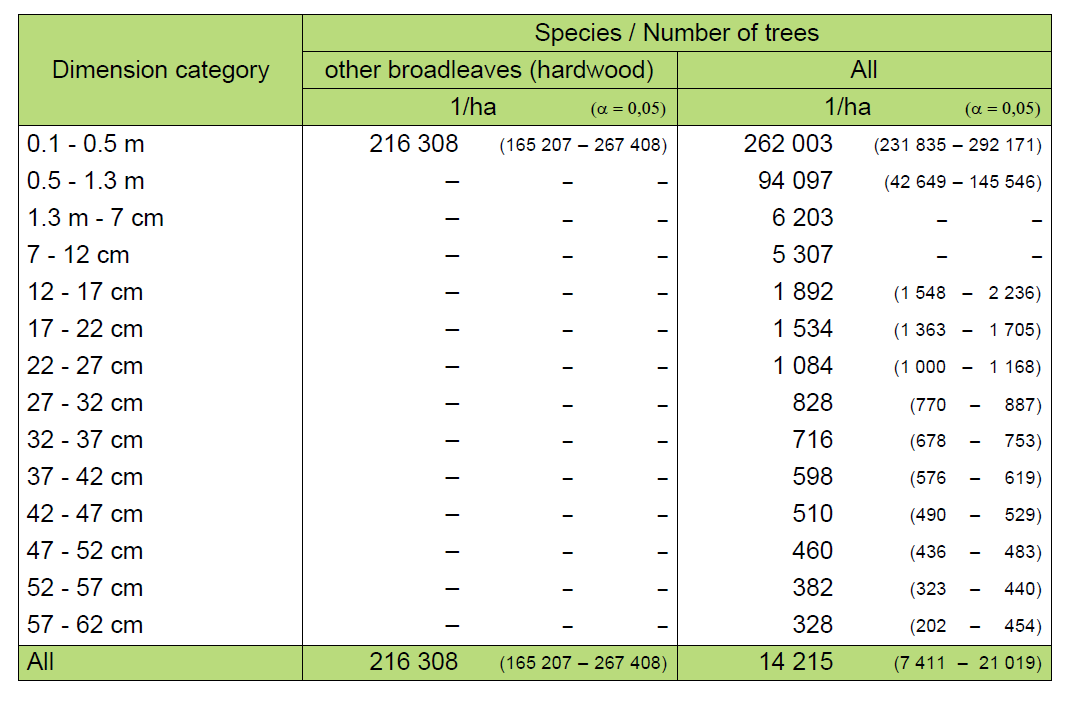
Result of this task plot out the information about density of trees (total number of trees) per area unit (ha) divided by defined species groups and dimension category. The main difference to the previous task is that here only area where regeneration is present is taken in account not whole study area as in the task above.
Requirements:
For that task is necessary to run the stratification by forest development types (seeStratification), to join trees from regeneration table to trees table (see Create virtualtrees for regeneration action), to reclassify species list into the species groups (seeRe-classification) and to classify trees into the dimension categories (see Classification and SQL update).
Procedure:
- Add new task and rename it.
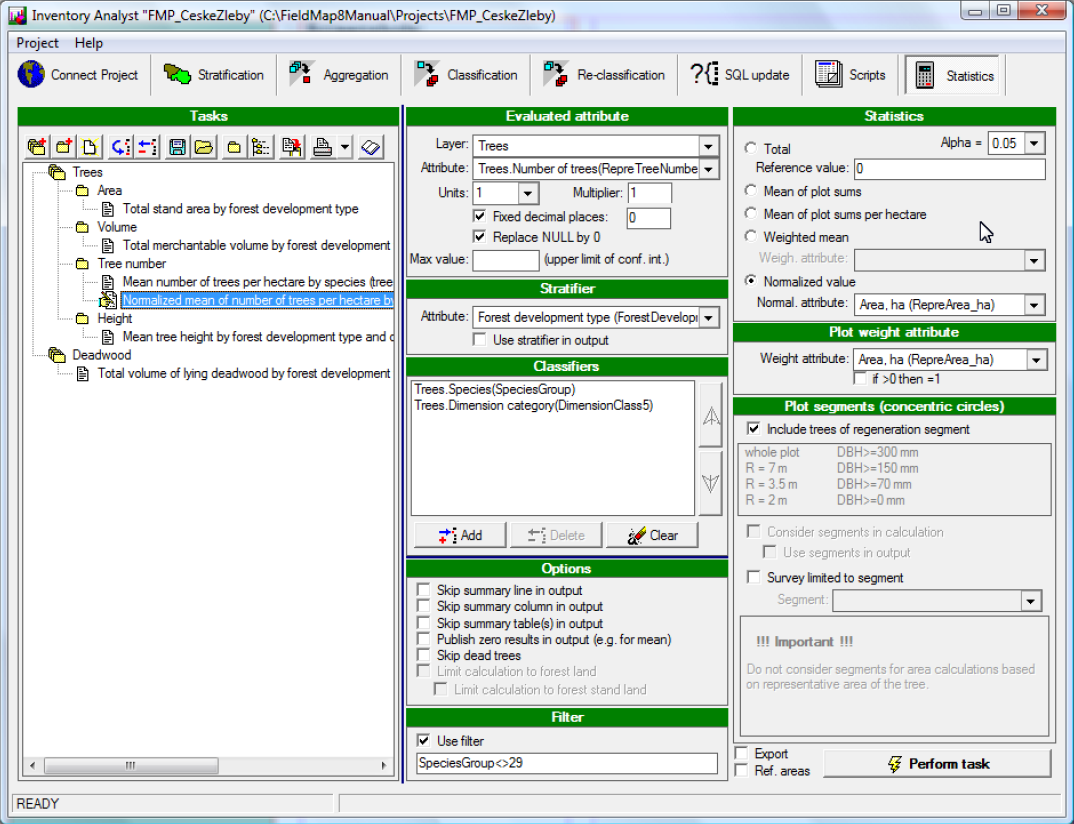
- Select “Trees.Number of trees (RepreTreeNumber)” attribute
- Set “1” in the Units combo box and “0” decimal places
- Select “Forest development type (Forest development type)” in Stratifier section and leave Use stratifier in output checkbox empty
- Select “Trees.Species (SpeciesGroup)” and Tree.Dimension category (DimensionClass5) as classifiers (Note: Click Add classifier button, tag “Trees. Species (SpeciesGroup)” and “Tree.Dimention category (DimensionClass5)” check boxes and click OK. The order of classifiers determines how the output table will be organized.)
- Select Normalized value and set “Area, ha (RepreArea_ha)” attribute in Normal.attribute combo box. Set desired Alpha (e.g. 0,05)
- Set “Area, ha (RepreArea_ha)” attribute as Weight attribute.
- Tag Include trees of regeneration segment Check box
- Run the task using Perform button
Comments
Whole plot is assigned to particular forest development type while performing stratification.At the same time the total area of each forest development type is calculated based onexisting vector map (shapefile).
Setting attribute ForestDevelopmentType as stratifier increases precision of the outputsince there is available information about size of the stratums derived from the map of forest development types. We may also assume that the variability within particular stratumis smaller than variability within whole population. The stratifier is not shown in the result for this particular task.
Two classifiers are used (i.e. Species groups and Dimension category). The output will be calculated for each combination of species group and dimension category.
Data is normalized using representative area of particular tree (Normal. attribute is set as Area, ha (RepreArea_ha)). This is the procedure which recalculates volume to unit volume (i.e. m3/ha).
Setting weight attribute as representative area points out the different share of the given species group within an inventory plot.
Because we are interested about all trees starting with 10 cm of height the check boxinclude trees of regeneration circle and consider segments in calculation have to be tagged. This ensures that trees of smaller dimensions (those from inner circles) are calculated in relation to the size of the subcircle they belong to (for details see Using concentric circlesat inventory plots). In our case three separate calculations are performed. Trees between 7 and 15 cm of DBH are processed in relation to the circle of radius 3,5 m, trees between15 and 30 cm of DBH are processed in relation to the circle of radius 7 m and finally treesabove 30 cm of DBH are processed in relation to the whole plot (radius of appr. 12,62 m). Error propagation procedure is used to combine those partial results to the final result.
Screenshots
Results:
|