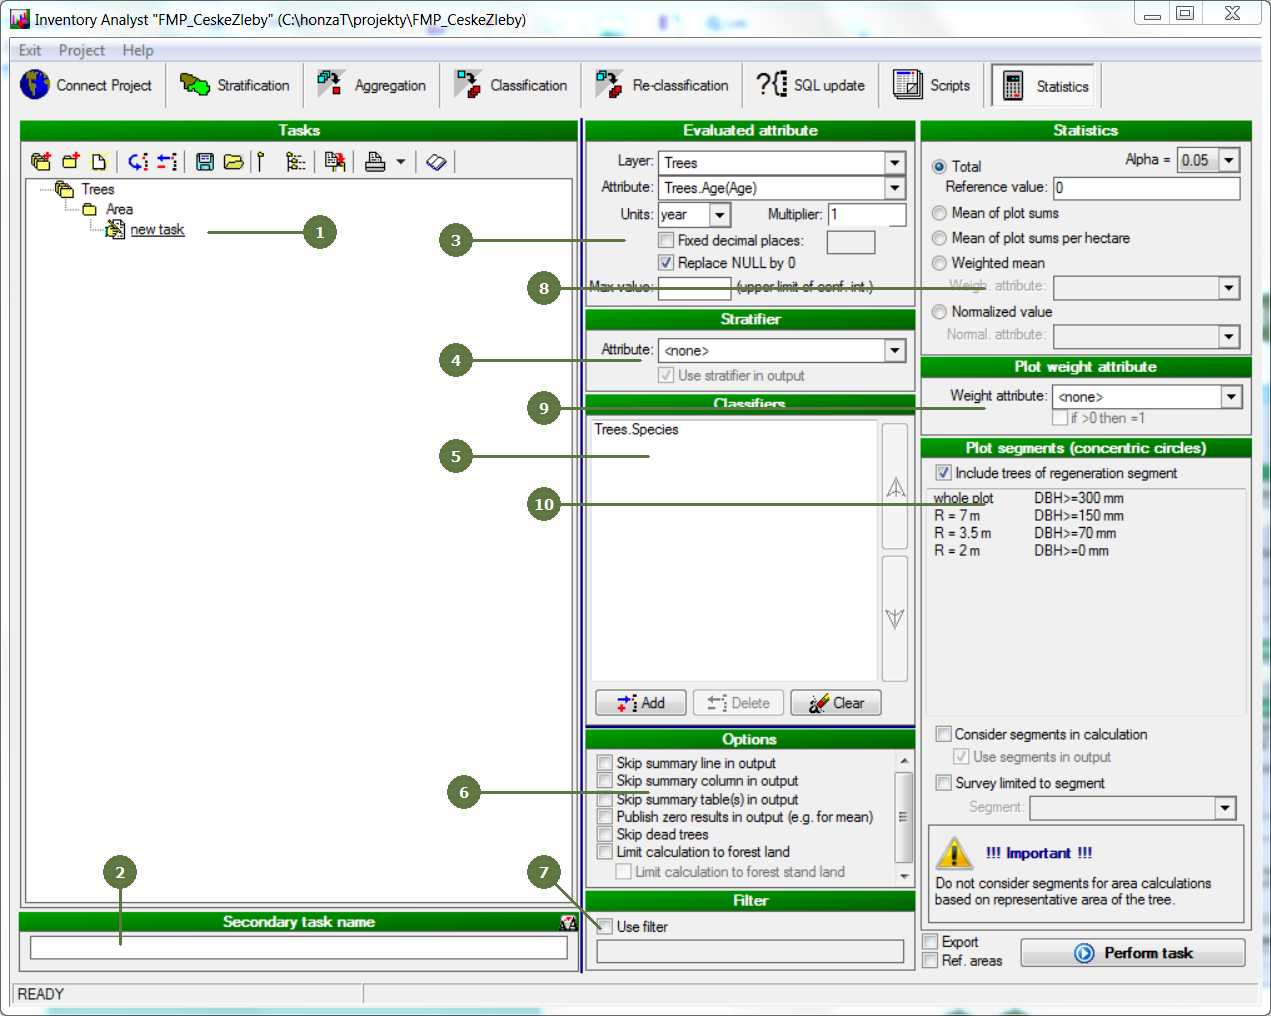
9.1 Statistics form
|
Each defined statistics task can be saved for possible further use. The filename extension of the saved statistics tasks is .sta (For more information see chapter Working with tasks)
Each task may have an additional name in the secondary language. Secondary task name is only visible if secondary language in the “Language of table headers” option is “on”.
Layer and Attribute: Select the layer and its attribute for the statistic calculation Units: Choose the unit of the evaluated attribute. Units will be printed in the output table Multiplier: Set the multiplier for the output data (usually 1, 10, 100, 1000 etc.) The default value is 1. Multiplier will be printed in the output table. Replace NULL by 0:If checked, missing values will be interpreted as 0 and included in the calculation; otherwise missing values will be excluded. The choice depends on the meaning of the statistics. For example, if the total area or volume by species is calculated, missing values (i.e., no observed species are presented at the plot) may be interpreted as 0, whereas if the mean tree height by species is calculated, missing values should be excluded.
Select the stratifier from the list. Note: stratifier should be a categorical variable with a limited number of values, attributed to plot or subplot. Use the stratifier in output – if checked, then the statistics for each stratifier value will be included in the output table, otherwise only summary statistic for the stratifier will be included, although its calculation anyway will be based on the stratified sampling. It is strongly recommended to include a stratifier in the task in order to improve the precision of calculation, even if you do not need to include it in the output. However, the stratifier should not be directly dependent on the variable under study, otherwise the confidence interval could be artificially reduced. In particular, if a mean of an age-dependent tree attribute (diameter, height etc.) is calculated, it is not recommended to use age class as stratifier.
Select one or more classifiers from the list. Classifier,as well as stratifier should be a categorical variable with a limited number of values. In contrast with stratifier, a classifier could be attributed to single tree, as well as to plot or subplot. Add button: press this button to add a classifier form the list of possible classifiers Delete button: press this button to delete the highlighted classifier Clear button: press this button to clear the list of classifiers
Use filter to reduce input data (e.g. do not include trees with height < 10m).
Select the type of output statistics. Alpha – select the confidence level from the list Mean of plot sums per hectare - mean of plot sums, each one related to the area of plot (or subplot) Weighted mean – weighted (or unweighted) mean of any attribute of a single tree (height, diameter, defoliation etc.) Weigh. attribute – select weight from the list. Choose 1 for unweighted mean Normalized value – mean of plot means, each one normalized by the plot total of a certain tree attribute (in particular, tree representative area). Note: when selecting tree representative area as normalizing attribute, in contrast with mean of plot sums per hectare the plot value will be related not to the whole plot (subplot) area, but only to the area occupied by trees, selected for calculation Normal. attribute – select normalizing variable from the list. Choose 1 for no normalization
Plot weights may be applied for weighted or normalized mean. For other statistics (in particular for total) plot weight with the option if >0 then 1 can be applied in order to limit the calculation to the area, where the attribute under study is presented. Select attribute of plot weight from the list. In the case of weighted mean it can be the same as weight attribute at tree level (in this case plot weight will be given by the sum of the given attribute per plot) or different. Select <none> if no plot weight applied. When option if >0 then 1 is checked, then plots with zero value of attribute under study will be excluded from the statistics, but the statistics will be unweighted.
Include trees of regeneration segment: Set if the regeneration segment will be included in the calculation or not. Optionally the calculation may be limited to a single segment selected from the list. Consider segments in calculation: if checked, concentric circles will be taken into account; it enables propagation of errors within the concentric circles Use segments in output: if checked, segments appears in the output Survey limited to segment: if checked, user can select a partial area (segment, sub-circle) drop-down list to limit the size of sample for particular statistical task (e.g. deadwood is sampled only within the inner circle of the inventory plot). |