9.3 Statistics theory
|
All the calculations set forth below concern the normally distributed variables. In practice often the variables are not normally distributed, in particular they may have a significant skewness. In such a case special methods of calculation can be applied. In particular, not the arithmetic mean, but another statistic (as median, geometric mean etc.) with its confidence interval can be the best estimator the population mean (see, e.g., Meloun et al., 1992). However, in the case of stratified sampling, when applying the special methods for non-normal distributions, the sum of stratum totals or the mean of stratum means may differ from the population total or mean, calculated without stratification. Consequently, in order to avoid such a contradiction, only standard calculations for normally distributed variables are applied |
Overview The following statistical variables can be estimated in the Inventory Analyst:
When calculating a sample mean, several variants of calculation can be applied beside of the standard arithmetic mean:
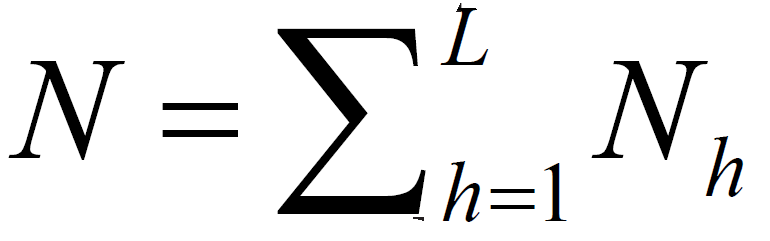
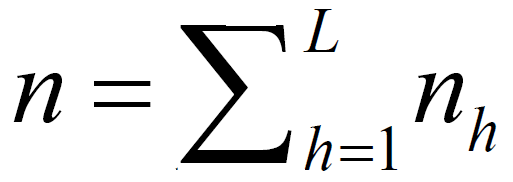
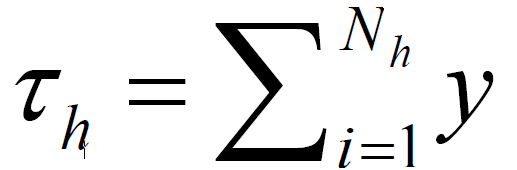
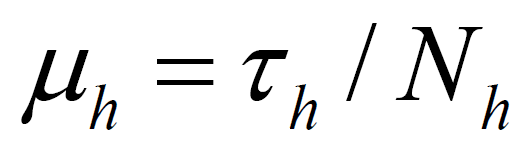
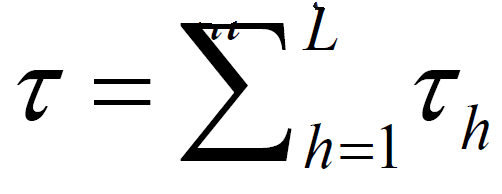
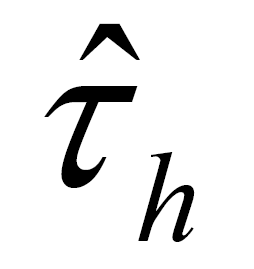
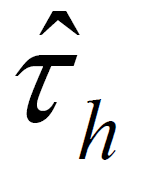
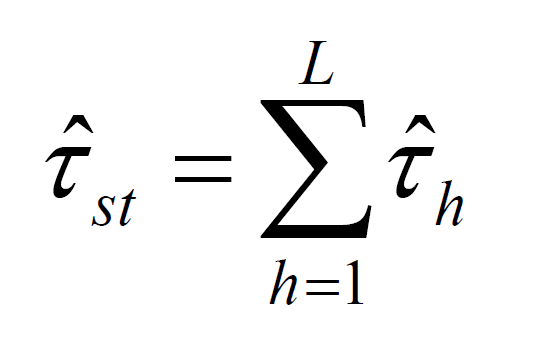
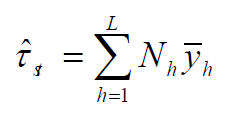
Statistical methods used in the Inventory Analyst represent standard methods used for simple and stratified sampling design (e.g. Thomson, 1992). A geographical region may be stratified into similar area by means of some known variable such as habitat type, elevation, or soil type. Even if a large geographic study area appears to be homogeneous, stratification into blocks can help ensure that the sample s spread out over the whole study area. The variable of interest associated with ith unit of stratum h will be denoted yhi. Let Nh represent the number of units in stratum h and nh the number of units in the sample from that stratum. L represents total number of strata. The total number of units in the population is stratum h is whole population is Estimating the population total Suppose within stratum h any specified design is used to select the sample sh of nh units, and suppose that one has an estimator the variance of variance. Then an unbiased estimator of the overall population total t is obtained by adding together the stratum estimators:
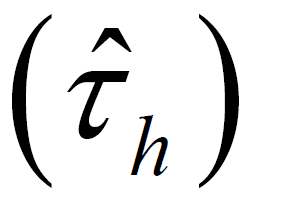
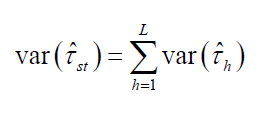
The variance of the stratified estimator, because of the independence of the selections in different strata, is the sum of the individual stratum variances:
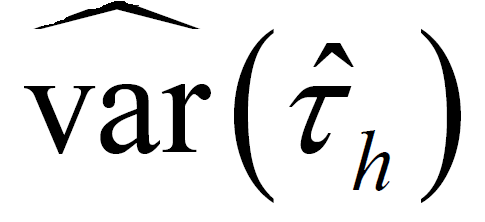
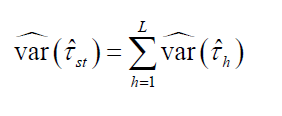
An unbiased estimator of that variance is the sum of individual stratum estimators:
If the sample is selected by a simple random sampling procedure without replacements in each stratum, then
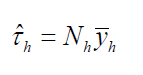
is an unbiased estimator of
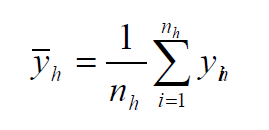
is the sample mean for stratum h. An unbiased estimator for the population total tis
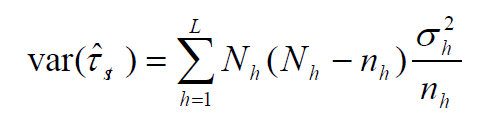
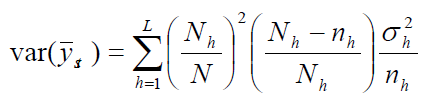
having variance
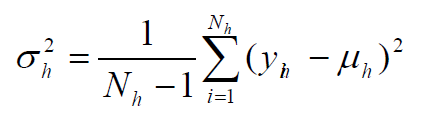
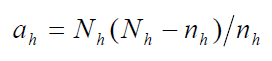
where
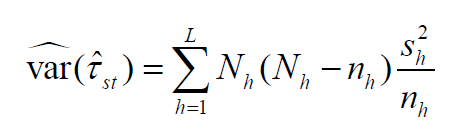
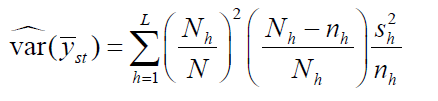
is the finite population variance from stratum h. An unbiased estimator of the variance of st tˆ is
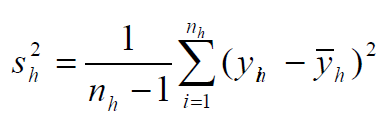
where
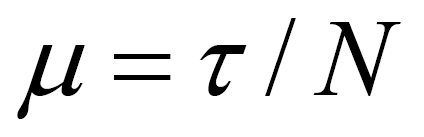
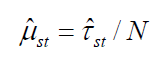
is the sample variance from stratum h. Estimating the population mean Since µ =t / N , the stratified estimator for µ is
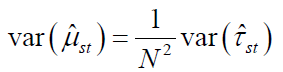
Assuming that the selection in different strata have been made independently, the variance of the estimator is
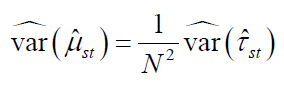
with unbiased estimator of variance
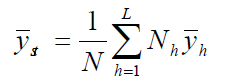
With stratified random sampling, an unbiased estimator of the population mean µ is the stratified sample mean:
Its variance is
An unbiased estimator of this variance is
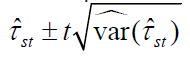
Confidence intervals When all the stratum sample sizes are sufficiently large, an approximate 100(1-a)% confidence interval for the population total is provided by
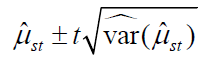
where t is the upper a/2 point of the normal distribution. For the mean, the confidence interval is
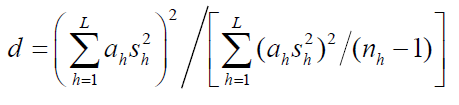
Usually, the normal approximation may be used if all the sample sizes are at least 30. With small sample sizes, the t-distribution with and approximate degrees of freedom may be used. The Satterthwaite (1946) approximation for the degrees of freedom d to be used is
where
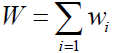
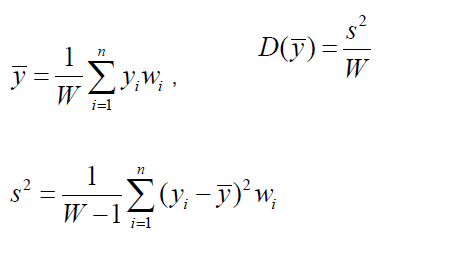
Considering variable weights Let us consider the variable xi weighted by value wi (i = 1,…,n). In equations for moments of y we should multiply any terms as yi or ( )k yi -y by wi and replace n by Consequently we receive the following set of equations:
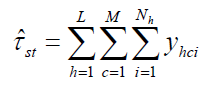
where D(.) is the operator of variance. In the current version weights are standardized before their further application such a way as W=N, i.e. each wi is replaced by wi·N/W. Using concentric circles at inventory plots Data of trees of different dimensions (based on diameter at breast height limits) are collected using concentric circles (see description of field data collection). Data collected on concentric circles are processed as being collected in individual inventory survey within stratum. Thus an unbiased estimator of the overall population total t is obtained by adding together the stratum and concentric circle estimators:
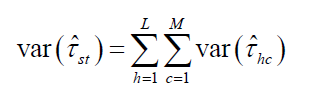
where M is a total number of concentric circles used in inventory design. For calculation of variance and subsequently for confidence interval for stratified sampling the variance related to individual concentric circles is summarized, supposing that the data from individual circles are incorrelated:
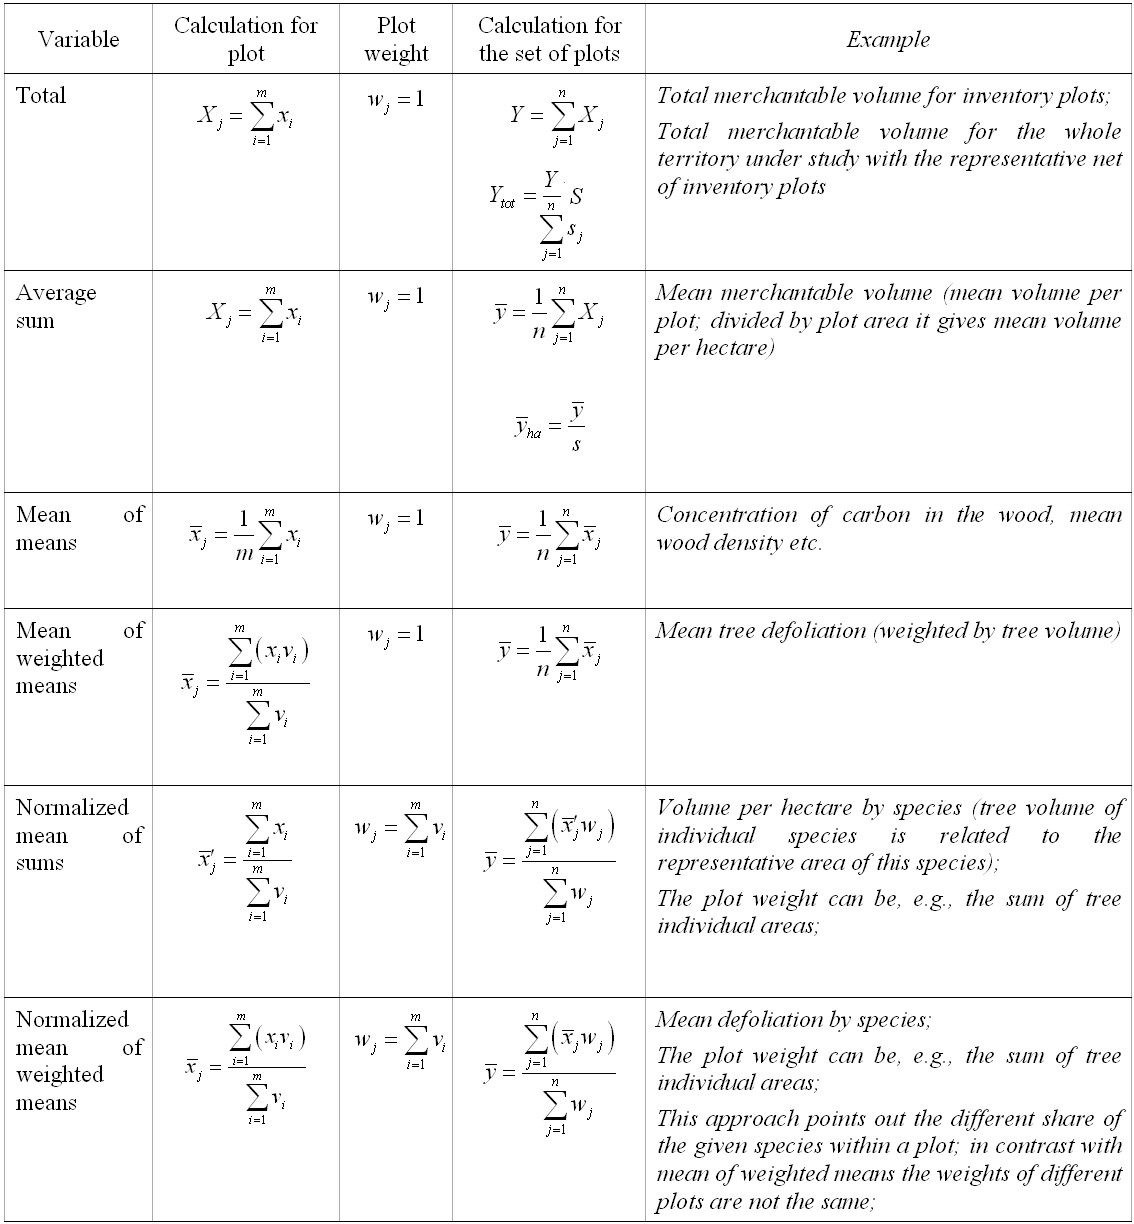
Review of equations applied in the Inventory Analyst Review of equations applied in the Inventory Analyst statistical calculations for individual inventory plots and for the whole dataset.
xi is the value of the variable under study for i-th entity (e.g., tree) within the plot j viis the weight of i-th entity within the plot j m is the number of entities within the plot j Xis the sum of the variable under study for plot j _ xjthe mean value of the variable under study for plot j _ x´jis the mean value of the variable under study per unit v for plot j wj is the weight of the j-th plot from the set of inventory plots Y is the total of is the variable under study for the whole dataset of plots Ytotis the total of is the variable under study for the whole territory of interest _ yis the mean value of the variable understudy for the dataset of plots _ yhais the mean value of the variable under study for the dataset of plots per hectare n is the total number of inventory plots in the dataset sis the area of inventory plot in hectares S is the area of the total territory of interest in hectares |