11.16 Showing vertical profile of a line
|
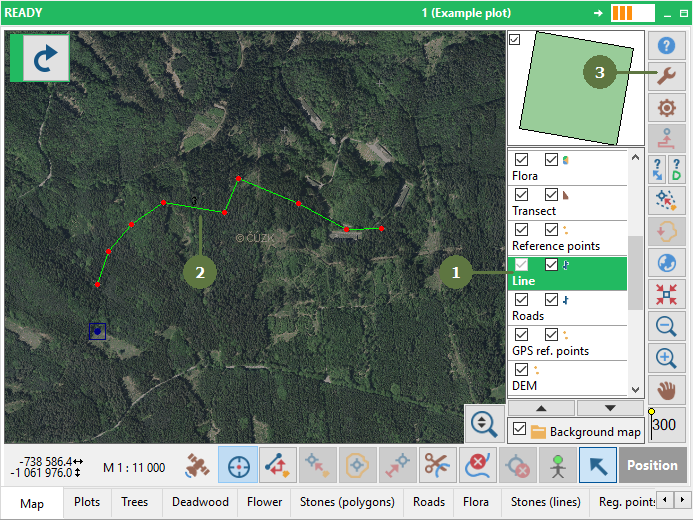
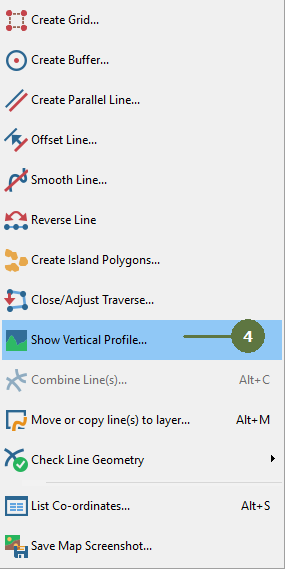
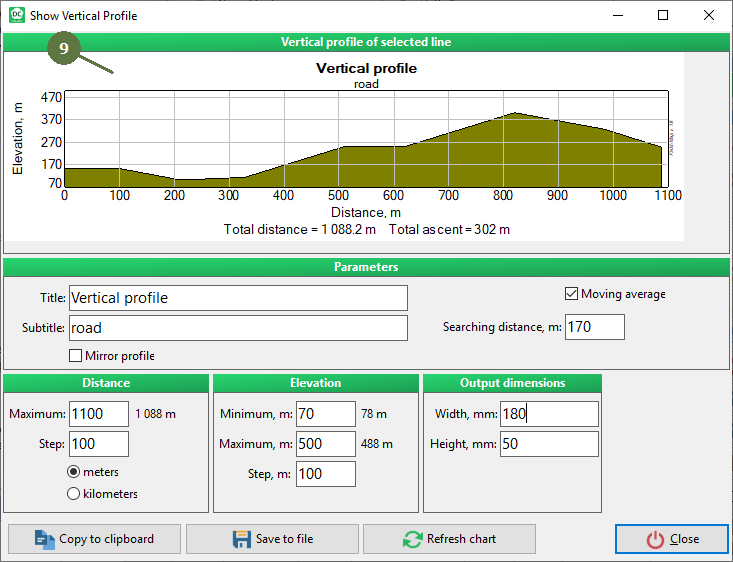
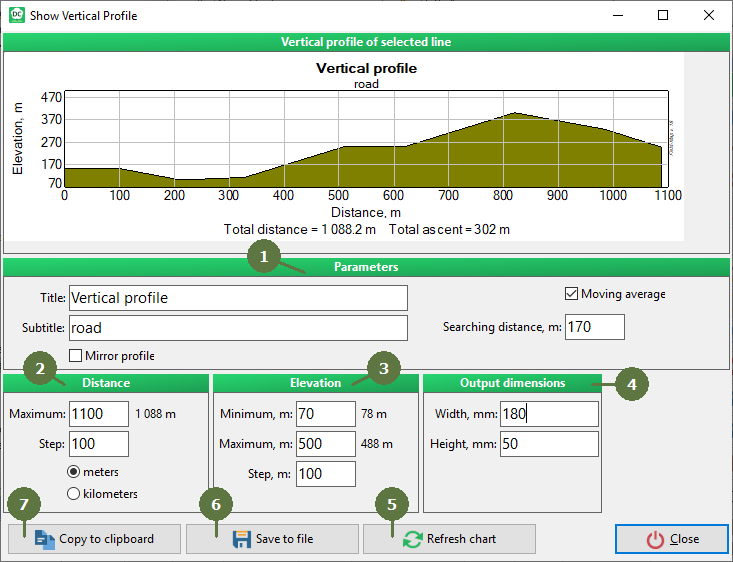
You can map lines by GPS or laser or import them from Digital Exchange Formats and display the vertical profile for each selected line. The profile can be exported to an enhanced metafile (EMF) or Windows bitmap format (BMP). |
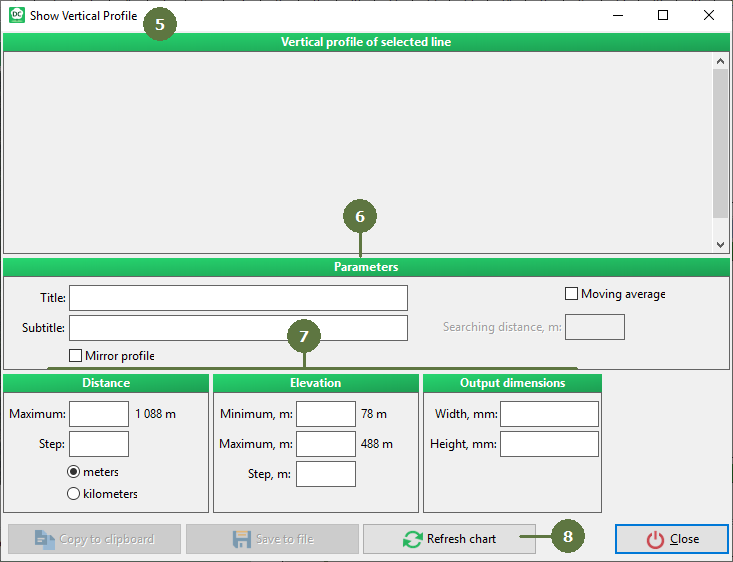
You can enter text used for title and subtitle of chart of vertical profile. Mirror profile: check this option to swap start and end point for calculation of vertical profile which results in mirrored chart. Moving average: check this option to trigger vertical profile calculation using moving average method. This method calculates height of each point of vertical profile as an average height of all points within the user defined searching distance. Searching distance, m: for moving average calculation set searching distance in meters. For any target point of vertical profile all source points within this distance from target point are included in calculation.
Maximum: set distance for which the chart is displayed (maximum for X-axis). On the right side of input box you can see a total length of line. Step: set step for labels on X-axis in meters or kilometers.
Minimum: set minimal elevation for which the chart is displayed (minimum for Y-axis) in meters. On the right side of input box you can see a minimal height of vertical profile of line. Maximum: set maximal elevation for which the chart is displayed (maximum for Y-axis) in meters. On the right side of input box you can see a maximal height of vertical profile of line. Step, m: set step for labels on Y-axis in meters.
Width, mm: set the width of the chart picture in milimeters. Height, mm: set the height of the chart picture in milimeters.
Click this button to draw the chart using current parameters.
Save picture with the chart to file. You can choose between vector file format (enhanced metafile) and raster file format (Windows bitmap).
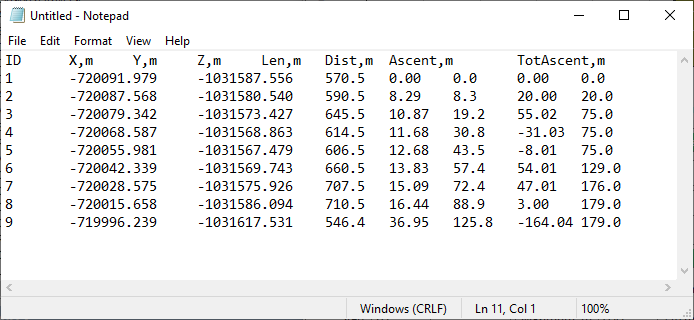
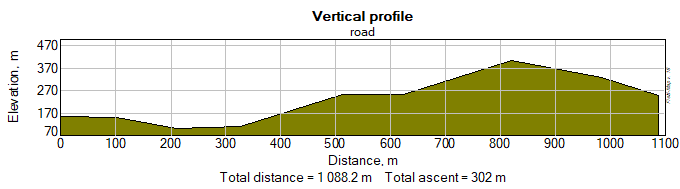
Copy Chart to clipboard: copy picture of the chart to clipboard to use it immediately in publishing or image processing application. Copy Data to clipboard: copy data of vertical profile to clipboard in text format to use them immediately in data processing application.
Example content of clipboard when “Copy Data to Clipboard” function is used and the data is copied to Notepad
Example content of clipboard when “Copy Chart to Clipboard” function is used and the data is copied to a program working with graphic |